
Search engine marketing reports help organizations understand how paid search campaigns are performing, where budgets are being spent, and which actions are producing meaningful business results. A well-structured report does more than list numbers; it connects campaign activity to goals such as lead generation, online sales, brand visibility, and customer acquisition. When interpreted correctly, these reports allow marketing teams, agencies, and stakeholders to make smarter decisions with greater confidence.
TLDR: Search engine marketing reports should focus on metrics that reveal both performance and profitability. The most important areas to track include impressions, clicks, click-through rate, cost per click, conversions, conversion rate, cost per acquisition, return on ad spend, and quality score. A strong report also explains trends, highlights opportunities, and recommends actions rather than simply presenting raw data.
Why Search Engine Marketing Reports Matter
Search engine marketing, often called SEM, involves paid ads that appear on search engines when users enter relevant queries. Because these campaigns involve direct media spend, reporting is essential for accountability. Stakeholders need to know whether campaigns are attracting the right audience, generating conversions, and supporting broader revenue goals.
An effective SEM report provides a clear view of campaign health. It shows which keywords are driving results, which ads are underperforming, and which landing pages may need improvement. Most importantly, it helps distinguish between surface-level activity and actual business impact. A campaign may generate thousands of clicks, but if those clicks do not lead to sales or qualified leads, the report should make that clear.
Core Visibility Metrics
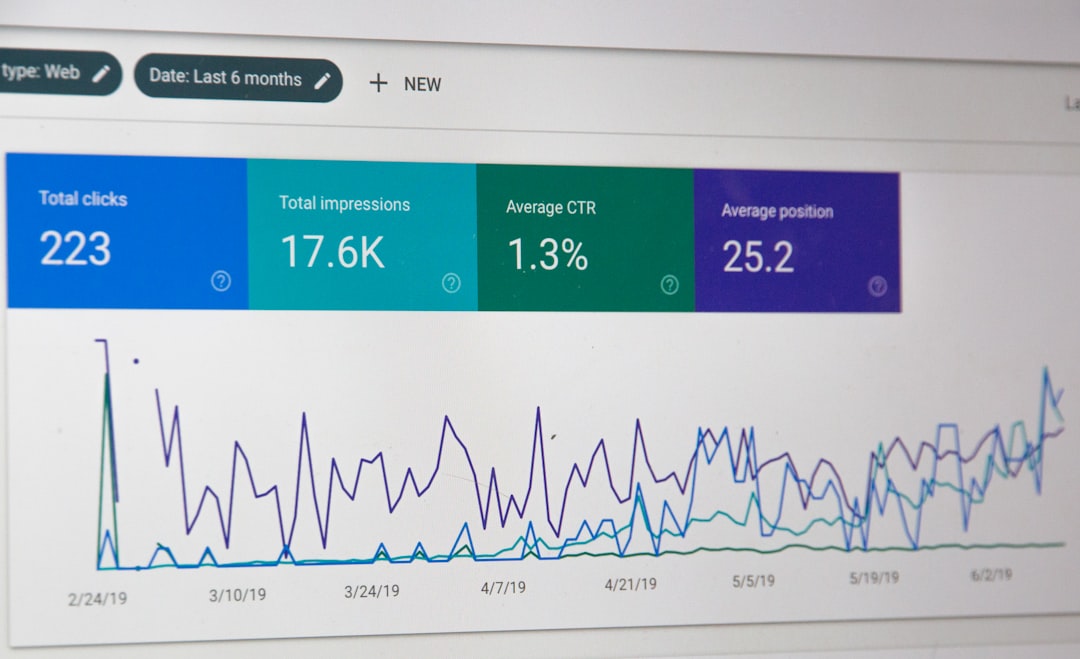
Visibility metrics show how often ads are appearing and how frequently users are engaging with them. These numbers are usually the first layer of an SEM report, especially for campaigns focused on reach, awareness, or market presence.
- Impressions: This metric measures how many times an ad was shown. High impressions may indicate strong keyword coverage, but impressions alone do not prove campaign success.
- Search Impression Share: This shows the percentage of available impressions the campaign actually captured. A low impression share may suggest limited budget, low bids, or weak ad relevance.
- Lost Impression Share: Reports often split this into losses due to budget and losses due to rank. This helps identify whether campaigns need more funding or better optimization.
Visibility metrics are especially useful when evaluating competitive pressure. If a campaign is losing impression share because of rank, improving ad quality, landing page relevance, or bid strategy may be necessary.
Engagement Metrics That Reveal User Interest
Once ads are visible, the next question is whether users find them relevant enough to click. Engagement metrics help measure how effectively ads capture attention and match search intent.
- Clicks: Clicks show how many users visited the landing page after seeing the ad. While important, clicks should always be evaluated alongside cost and conversion data.
- Click-Through Rate: CTR is calculated by dividing clicks by impressions. A higher CTR usually indicates that the ad copy, keyword targeting, and user intent are well aligned.
- Average Position or Top Impression Rate: Although traditional average position has become less central in many platforms, top impression data still helps show how prominently ads appear.
A low CTR may indicate that ad messaging is not compelling, keywords are too broad, or competitors are presenting stronger offers. In a strong report, this metric should be paired with practical recommendations, such as testing new headlines or refining match types.
Cost Metrics for Budget Control
SEM campaigns require close cost monitoring because every click has a price. Cost metrics show how efficiently advertising budget is being used and whether spending aligns with campaign objectives.
- Total Cost: This is the total amount spent during the reporting period. It should be compared with budget pacing and performance outcomes.
- Cost Per Click: CPC measures the average amount paid for each click. Rising CPCs may reflect increased competition or lower quality scores.
- Daily Budget Utilization: This helps determine whether campaigns are underspending, overspending, or limited by budget too early in the day.
Cost metrics become more valuable when connected to conversion results. A high CPC is not automatically negative if those clicks produce profitable customers. Likewise, a low CPC may be inefficient if traffic quality is poor.
Conversion Metrics That Define Success
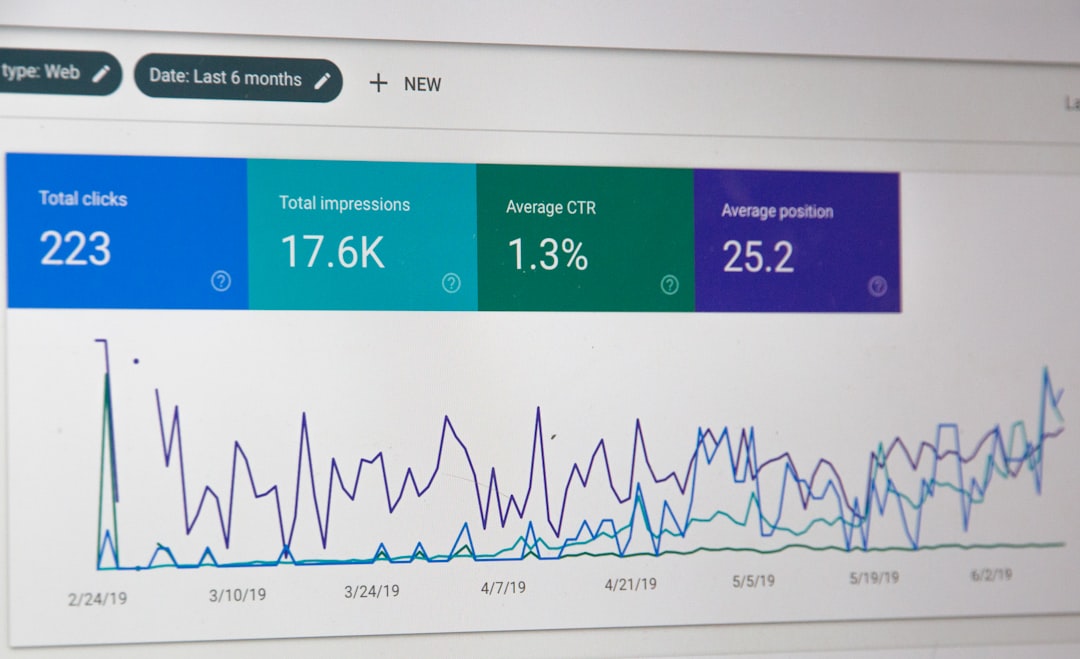
Conversion metrics are the foundation of performance-based SEM reporting. They show whether users are taking valuable actions after clicking an ad. Depending on the business, conversions may include purchases, contact form submissions, phone calls, demo requests, app downloads, or newsletter signups.
- Conversions: This is the total number of completed actions attributed to the campaign.
- Conversion Rate: This measures the percentage of clicks that turned into conversions. A weak conversion rate may indicate issues with landing pages, audience targeting, or offer clarity.
- Cost Per Conversion: Also called cost per acquisition or CPA, this shows how much is spent to generate one conversion.
- Conversion Value: For ecommerce or revenue-tracked campaigns, this shows the monetary value generated from conversions.
Conversion tracking must be configured correctly for reports to be reliable. If tracking tags, analytics goals, or attribution settings are inaccurate, the report may lead to poor decisions. For this reason, SEM reports should include notes about tracking changes, missing data, or unusual reporting conditions.
Revenue and Profitability Metrics
For many organizations, the most important SEM question is not simply whether campaigns generate conversions, but whether they generate profitable growth. Revenue metrics help connect ad spend to financial outcomes.
- Return on Ad Spend: ROAS compares revenue generated to the amount spent on ads. For example, a ROAS of 400% means the campaign produced four dollars in revenue for every dollar spent.
- Customer Acquisition Cost: This calculates the average cost of acquiring a new customer through paid search.
- Lifetime Value: LTV estimates the long-term revenue a customer may generate. Comparing LTV with acquisition cost gives a more complete view of profitability.
ROAS is particularly important for ecommerce campaigns, but it should not be viewed in isolation. A campaign with lower immediate ROAS may still be valuable if it attracts high-value repeat customers. Reports should therefore explain how short-term and long-term value are being considered.
Quality and Relevance Metrics
Search engines reward campaigns that provide relevant, useful experiences for users. Quality metrics help explain why some ads cost less and perform better than others.
- Quality Score: This evaluates expected CTR, ad relevance, and landing page experience. A higher score can reduce CPC and improve ad placement.
- Ad Relevance: This indicates how closely the ad matches the user’s search intent.
- Landing Page Experience: This measures whether the destination page is useful, fast, relevant, and easy to navigate.
These metrics are often overlooked, but they can reveal major optimization opportunities. Improving relevance may reduce costs while increasing conversions, making it one of the most efficient ways to improve campaign performance.

Keyword and Search Term Performance
Keyword-level reporting shows where results are coming from. It helps identify the terms that attract profitable traffic and the queries that waste spend.
Reports should highlight top-performing keywords, underperforming keywords, and negative keyword opportunities. Search term analysis is especially valuable because it reveals the actual queries users typed before clicking. This can uncover new keyword ideas, irrelevant traffic, and mismatches between intent and ad targeting.
For example, a broad match keyword may produce many clicks, but the search term report might show that several queries are unrelated to the offer. Adding negative keywords can quickly improve efficiency and reduce wasted spend.
How to Present SEM Report Data Effectively
A strong SEM report should be easy to understand, even for stakeholders who are not advertising specialists. It should include visual summaries, concise commentary, and clear recommendations. Raw data tables are useful, but they should not replace interpretation.
- Start with goals: The report should explain what the campaign was intended to achieve.
- Show period comparisons: Comparing results month over month or year over year helps identify trends.
- Segment data: Performance may vary by device, location, audience, keyword type, and campaign.
- Explain changes: Budget adjustments, bid strategy changes, new ads, or landing page updates should be documented.
- Recommend next steps: Every report should end with actions, such as pausing poor keywords, testing new copy, or increasing budget for profitable campaigns.
Common SEM Reporting Mistakes
Several mistakes can reduce the value of SEM reports. One common issue is focusing too heavily on vanity metrics, such as impressions or clicks, without connecting them to conversions and revenue. Another problem is reporting too many metrics without explaining which ones matter most.
Reports may also become misleading when attribution is ignored. Paid search often interacts with other channels, including organic search, email, social media, and direct traffic. While attribution models are not perfect, reports should acknowledge how credit is assigned to conversions.
FAQ
What is an SEM report?
An SEM report is a performance summary of paid search campaigns. It typically includes visibility, engagement, cost, conversion, and revenue metrics.
Which SEM metric is most important?
The most important metric depends on the campaign goal. For lead generation, cost per acquisition may be most important. For ecommerce, return on ad spend is often the key metric.
How often should SEM reports be reviewed?
Most campaigns benefit from weekly monitoring and monthly reporting. High-spend campaigns may require daily checks to manage budgets and performance changes.
Why is conversion tracking important?
Conversion tracking shows whether paid clicks lead to valuable actions. Without it, campaign decisions may be based only on traffic rather than business results.
What should an SEM report include besides metrics?
It should include insights, explanations for performance changes, tracking notes, and recommended next steps. The best reports turn data into clear decisions.